From Data to Decision: How RYTM AI Calculates a Stock Score
Our 1-10 score isn't a black box. It's the result of a disciplined, multi-layered analysis designed to find what really matters—and the historical data shows it works.
Since launching RYTM to the public, the response has been incredible. Thank you to our first wave of users who have signed up and started exploring. As more investors use the platform, one question has come up more than any other: "How do you actually calculate the stock scores?"
It's a fair question. In a world full of financial noise, a single number needs to be backed by a solid, transparent methodology. The RYTM score is not a "black box" prediction; it's the output of a consistent analytical process designed to answer the most important questions an investor has.
Our entire philosophy is built on identifying what truly moves stock prices over the medium term: the acceleration or deceleration of business growth. Knowing a company's profit grew 12% is useful, but knowing it accelerated from 6% last quarter to 12% this quarter is a game-changing insight.
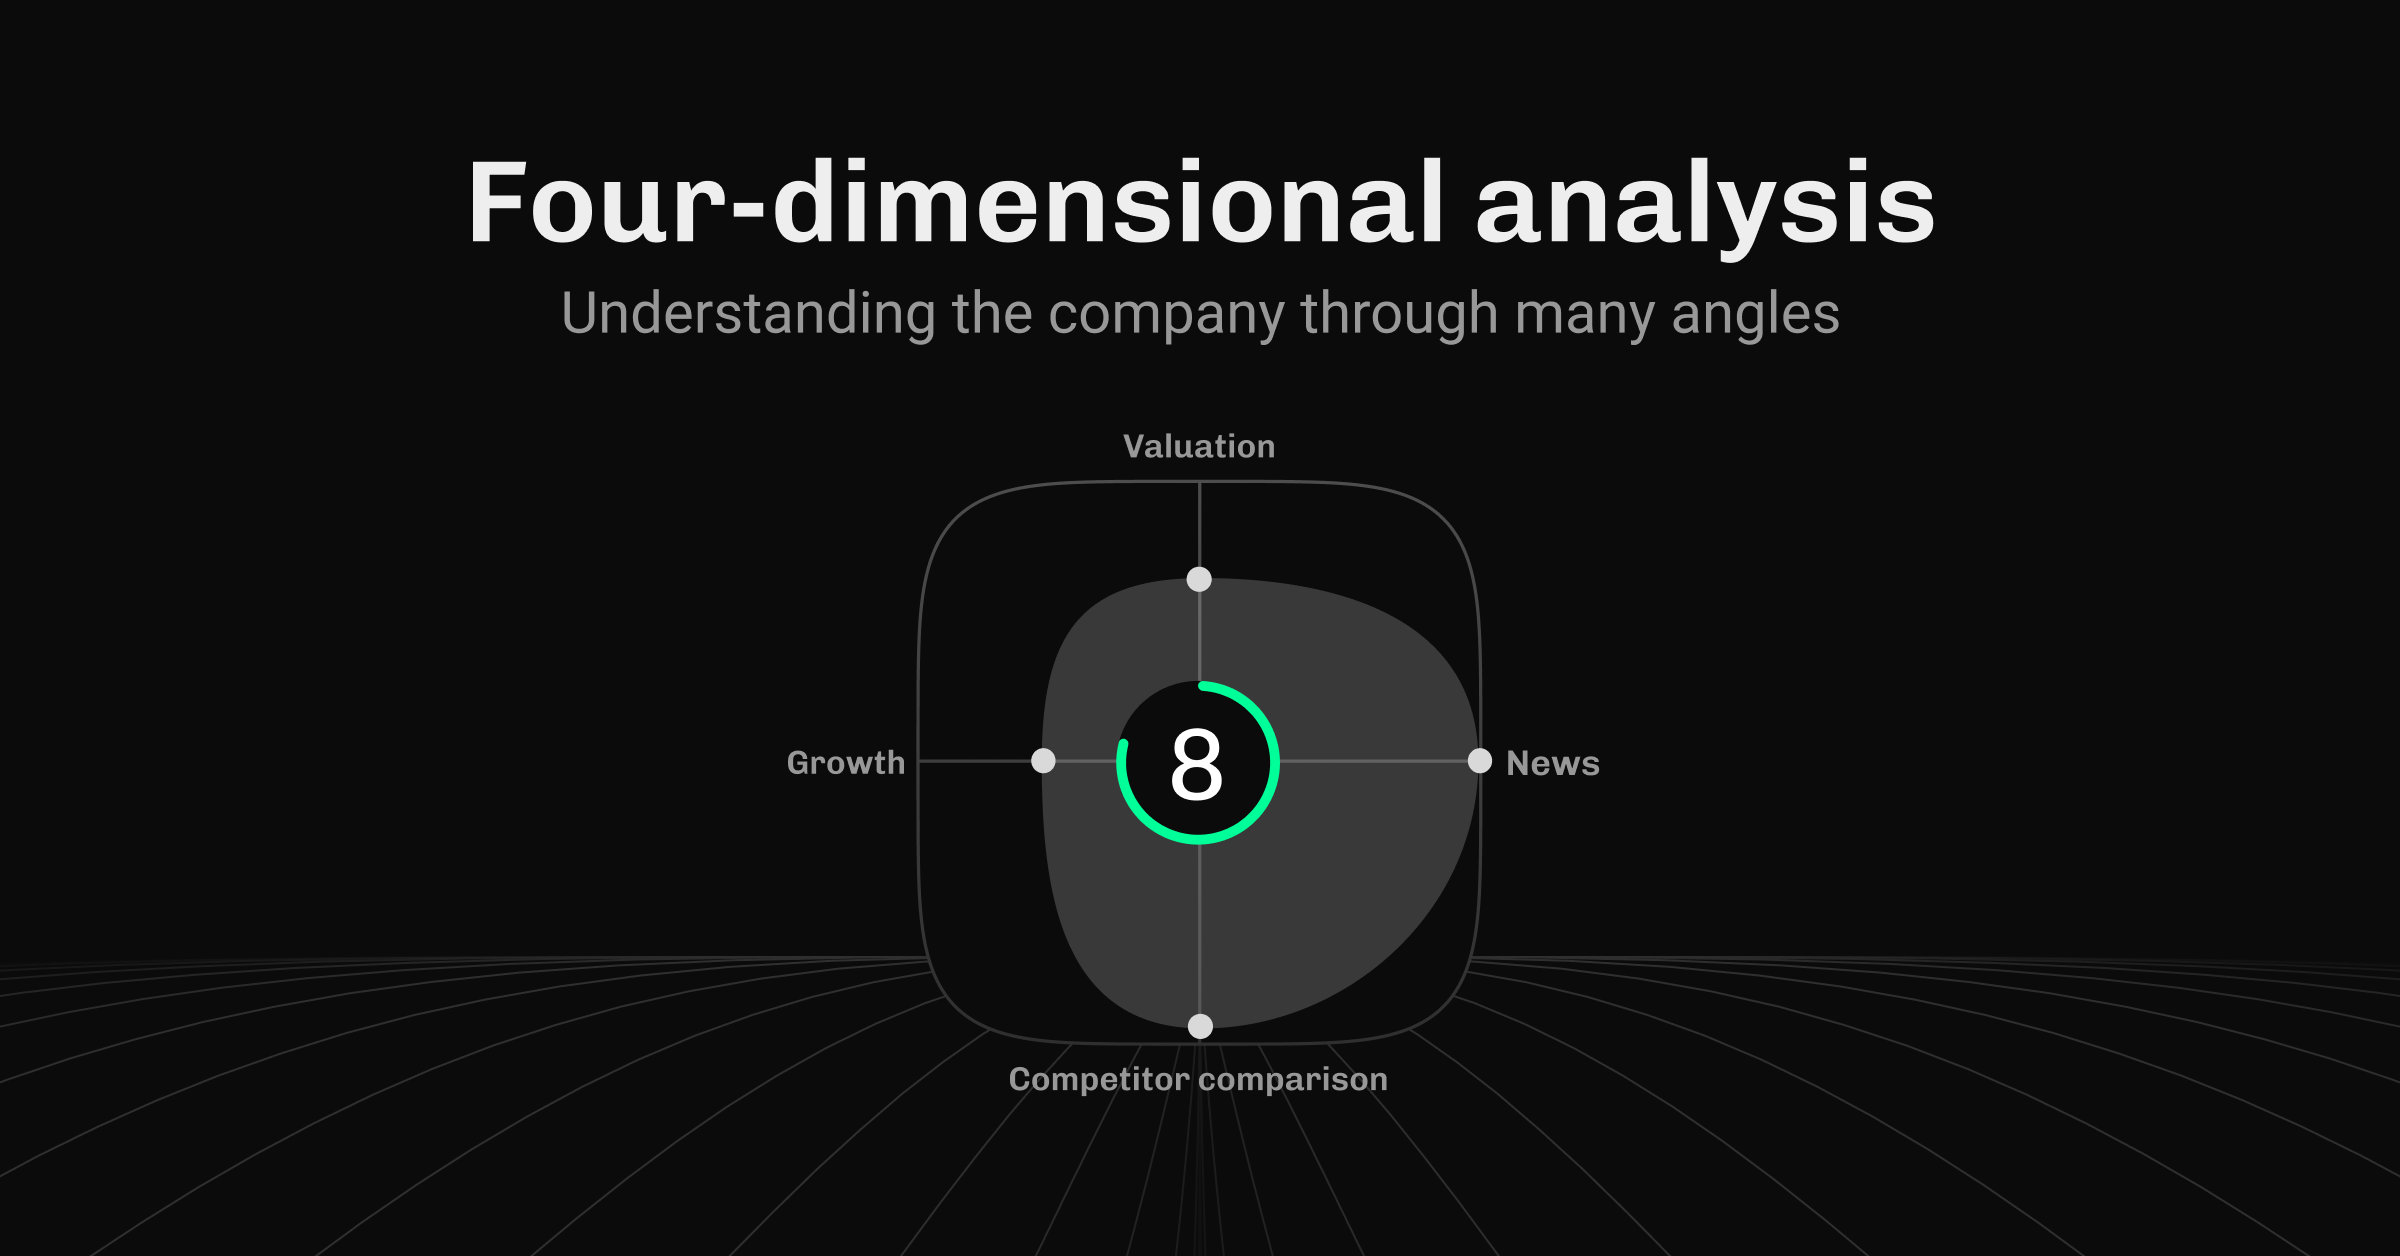
The RYTM score is a result of combining four distinct analytical pillars.
Pillar 1: Business Acceleration Analysis (The "What" and "Why")
This is our "core truth." We start with the facts from quarterly financial reports.
- What changed? We pinpoint the most critical performance metric (like revenue or profit) and determine if its growth is accelerating or decelerating.
- Why did it change? We then dig into the report to find the reason. The score isn't just based on the number; it's weighted by the explanation. For example, growth acceleration driven by a core product's soaring popularity is more significant than growth from a one-off asset sale. We tell you, "Profit growth accelerated to 12% because apartment sales more than doubled."
Pillar 2: Competitive Landscape Analysis
A company doesn't exist in a vacuum. A 10% growth rate might be fantastic in a stagnant industry but terrible in a sector where competitors are growing at 30%. RYTM automatically puts a company's performance into context by comparing its key metrics against its main peers. This tells you if the company is a market leader or a laggard.
Pillar 3: News Analysis (The Forward-Looking Layer)
Financial reports are, by nature, backward-looking. They tell you what happened. To get a sense of what might happen next, we continuously analyze news flow. Our AI reads and understands news to assess whether the trends seen in the last financial report are likely to continue, strengthen, or reverse. This adds a crucial, forward-looking dimension to the factual baseline.
Pillar 4: Valuation in Context
Finally, we look at the price. But instead of just stamping a "cheap" or "expensive" label on a stock, we provide context. RYTM shows you the stock's price chart overlaid with its historical scores. This allows you to see how the market has previously reacted when the stock had a similar fundamental profile (a similar score). It helps answer the question: "Is the current good news already priced in?"
The Result: A Single, Trustworthy Score
By synthesizing these four pillars, RYTM produces a single score from 1 to 10. It’s an evaluation that is:
- Consistent: Every stock, from a Baltic small-cap to a US tech giant, is analyzed using the same disciplined principles.
- Holistic: It combines financials, competitive context, news sentiment, and valuation.
- Transparent: We always show you the "why" behind the score.
But how does this approach perform over time and across the entire market?
We believe in radical transparency, so we show the historical performance of our scores right in the app. Our analysis of 1350 scores given between July 2023 and September 2025 shows a clear and powerful trend:
- Stocks with a high score (9-10) have historically generated an average Compound Annual Growth Rate (CAGR) of 24.4%.
- Stocks with a low score (1-2) have historically generated an average CAGR of -1.1%.
- This compares to the market average of 15.1% for all stocks analyzed during the same period.
Our mission is to make deep investment analysis easy and accessible. The first step is providing a tool you can understand and trust.
Download RYTM and try it for free:
All content, data, and analysis provided by RYTM are for informational and educational purposes only. They do not constitute financial advice, investment advice, or a recommendation or solicitation to buy, sell, or hold any security. You are solely responsible for your own investment research and decisions. Always consult with a licensed financial professional before making any investment.