Historical Accuracy of RYTM AI scores
RYTM AI gives each stock a score (1-10), but how accurate have these scores been historically?
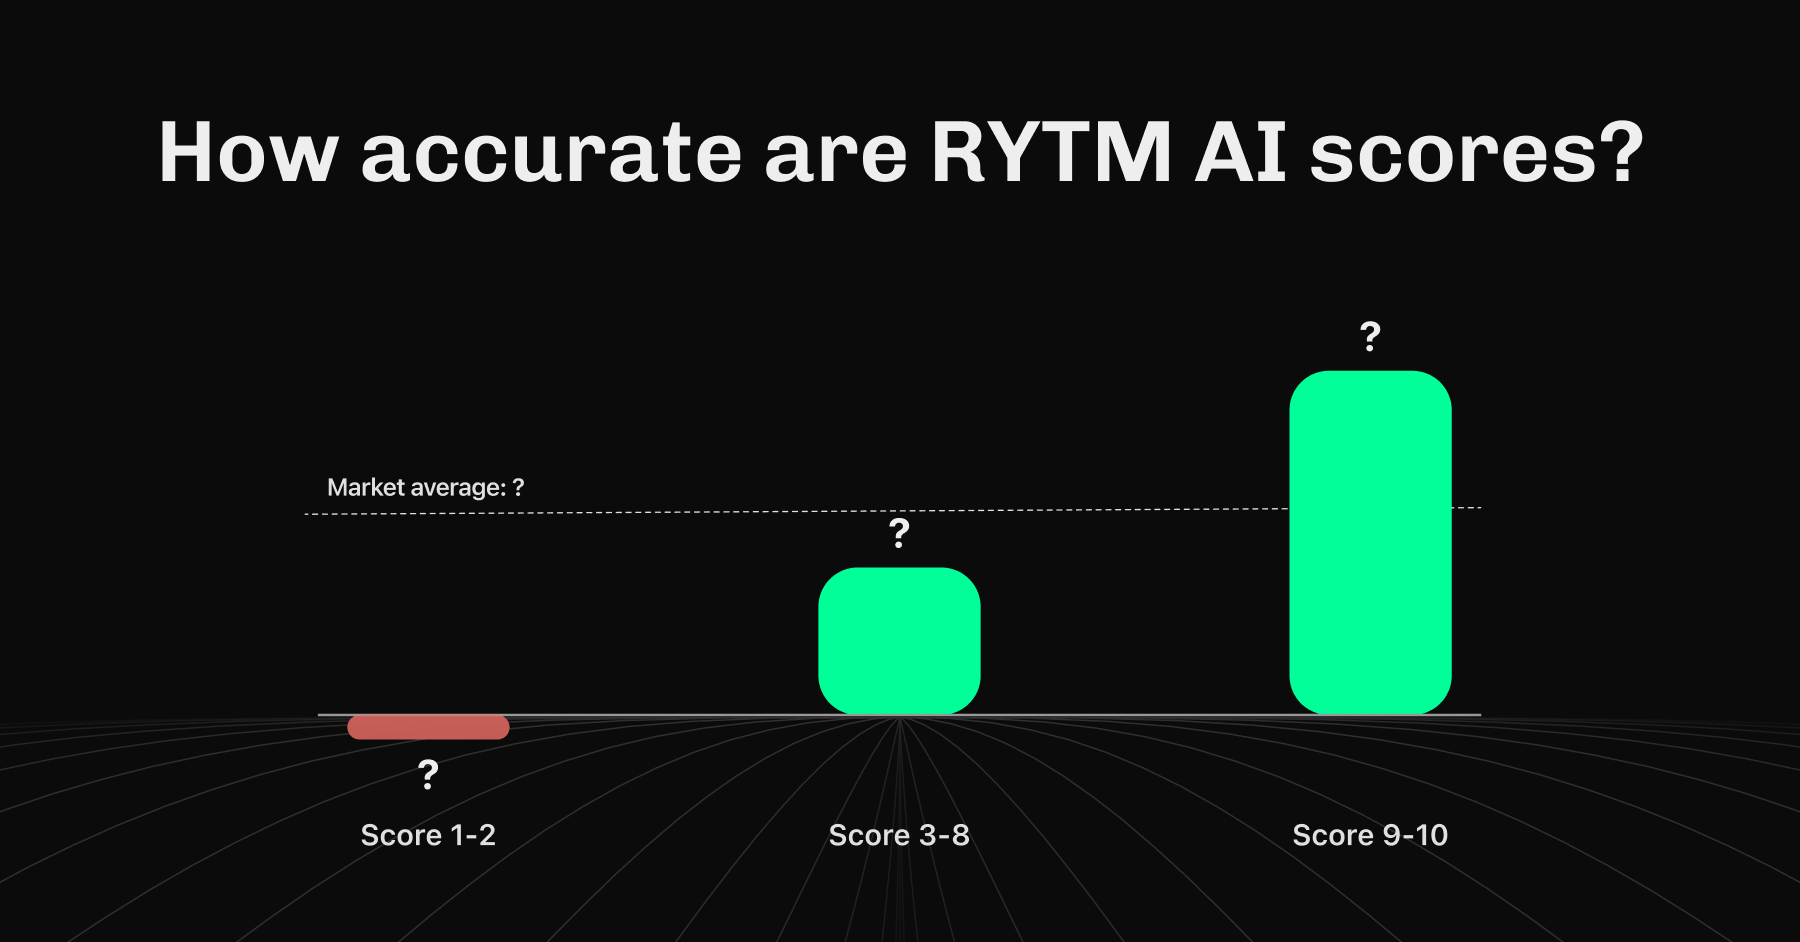
We summarized the returns of RYTM AI scores over the last years. The analysis includes all stocks covered by RYTM (Baltic, Helsinki, Nasdaq-100): The chart below shows that stocks that have received a high RYTM AI score (9-10) have systematically outperformed the average market return. Meanwhile, low scores have fallen below the market average or even shown negative returns.
It is important to note that this is an average return, assuming a portfolio was composed of all stocks with these scores (for example, if an investor had bought all stocks with a score of 10). RYTM is not a magic machine, and not all high scores will achieve positive returns. Similarly, in the past, there have been low-scoring stocks that have risen significantly after receiving a low score.
The time horizon for RYTM AI scores is 3 months, and figuratively, the algorithm tries to assess "how well the stars are aligned for the stock." Higher scores indicate that the company is doing well: business growth is accelerating, the company is stronger than its competitors, and recent news shows a continuation of these trends, while low scores indicate the opposite.
While our current AI algorithm shows a strong correlation with returns, we are actively working to continuously develop our scoring to increase the probability of positive returns for high-scoring stocks.
Historical returns are always available in the RYTM app in the single stock view under the "Score overview" button.
Download RYTM and try it for free:
All content, data, and analysis provided by RYTM are for informational and educational purposes only. They do not constitute financial advice, investment advice, or a recommendation or solicitation to buy, sell, or hold any security. You are solely responsible for your own investment research and decisions. Always consult with a licensed financial professional before making any investment.